Hany W Darwish1,2 ![]() ,
Ahmed H Bakheit1
,
Ahmed H Bakheit1
For correspondence:- Hany Darwish Email: hdarwish75@yahoo.com
Received: 24 May 2016 Accepted: 11 September 2016 Published: 31 October 2016
Citation: Darwish HW, Bakheit AH. A new spectrofluorimetric assay method for vandetanib in tablets, plasma and urine. Trop J Pharm Res 2016; 15(10):2219-2225 doi: 10.4314/tjpr.v15i10.21
© 2016 The authors.
This is an Open Access article that uses a funding model which does not charge readers or their institutions for access and distributed under the terms of the Creative Commons Attribution License (http://creativecommons.org/licenses/by/4.0) and the Budapest Open Access Initiative (http://www.budapestopenaccessinitiative.org/read), which permit unrestricted use, distribution, and reproduction in any medium, provided the original work is properly credited..
Purpose: To develop a simple and sensitive spectrofluorimetric method for the determination of vandetanib (VDB) in tablets (containing 100 mg of the drug) and biological fluids (spiked human plasma and urine).
Methods: The proposed method is based on examining the intrinsic fluorescence intensity of VDB in acetonitrile at 480 nm after excitation at 330 nm. Factors affecting fluorescence intensity of the cited drug (VDB), including the influence of pH, diluting solvent and time, were studied and optimized by one factor at a time approach. A calibration curve was constructed by plotting VDB fluorescence intensity at 480 nm versus VDB concentrations in ng mL-1. The method was validated according to the recommendations of International Conference on Harmonisation (ICH) for validation of the analytical procedures
Results: The linearity range of the method was 20 – 600 ng mL-1, with limits of quantification (LOQ) and of detection (LOD) of 30.45 and 10.05 ng mL-1, respectively. The adopted method was applied successfully to the quantitation of VDB in pure powder form (100.90 ± 0.91 %), laboratory prepared tablets (97.86 ± 1.42 %), spiked human plasma (97.97 ± 2.36 %) and urine (97.59 ± 0.87 %). Comparison of the proposed method with that of liquid chromatography-tandem mass spectrometry showed that there was no significant difference (p < 0.05) between the two methods in terms of accuracy and precision.
Conclusion: The proposed method is simple and highly sensitive and, consequently, can be applied to assay VDB in biological samples as well as in dosage form.
Introduction
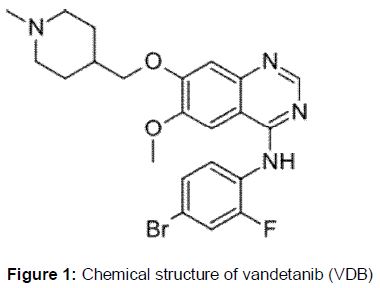
Vandetanib (VDB) is considered one of the novel tyrosine kinase inhibitors (TKIs) that acts by inhibiting numerous receptors of the human cell such as RET-tyrosine kinase, epidermal growth factor receptor and others [1,2]. It is prescribed for treating progressive or symptomatic medullary carcinoma of thyroid glands. The effectiveness of VDB for treating ER negative breast cancers was also suggested by modern preclinical researches [3]. Moreover, VDB could be used solely or in combination with other treatment regime such as chemotherapy or radiotherapy for managing other kinds of tumors [4,5]. Consequently, it is expected that VDB will be widely spread as an effective anticancer in the near future. The chemical structure of VDB is displayed in .
Establishing simple and sensitive analytical method for quantitation of VDB in different matrices is very important as the therapeutic monitoring of a certain medication (VDB in our case) is relied upon the accurate analysis of this medication. Additionally, understanding the relationship between the concentration level and activity of VDB is crucial for its routine and safe usage by the patients. Spectrofluorimetric analysis characterized by various advantages for instance sensitivity and simplicity and wide availability of instrument in quality control laboratories [6,7]. For these advantages, this technique was adopted for developing a unified analytical method for quantitation of VDB in different matrices.
Only a few published articles have been reported for VDB assay in plasma or other biological fluids. These analytical methods included liquid chromatographic methods coupled with; mass spectrometry [8-11], diode array [12] and UV detection [13]. The disadvantages of these methods are complexity, high cost and wasting of time in addition to laborious sample treatment. VDB assay in urine samples was reported by just one liquid chromatographic method coupled with mass spectrometry [9] while there are no previous reports, to the best of our knowledge, regarding the assay of VDB in tablets or pure bulk powder. Thus the aim of the present study was to develop a simple, sensitive and unified analytical method for the assay of VDB in various forms based on the native fluorescence of VDB.
Methods
Apparatus
Fluorescence measurements were performed utilizing a Jasco FP-8200 Fluorescence Spectrometer (Jasco Corporation, Japan) equipped with a xenon lamp (150 W) and quartz cells (one cm). Excitation and emission slit widths for both monochromators were adjusted at 5 nm. Quinine sulphate (0.01 µg mL-1) was utilized for frequent calibration of Jasco FP-8200 Spectrometer and the recorded spectra were transformed to ASCII format using Spectra Manager® software.
Reagents and materials
All the chemicals used in this study were of analytical reagents grade, and the solvents of HPLC grade.
Vandetanib reference standard (purity ~ 99.5 %) was purchased from LC Laboratories (MA, USA). Methanol, ethanol (Prolabo, France) and acetonitrile (Sigma-Aldrich Chemie GmbH, Germany). Ultrapure water ≥ 18.2 MΩ was obtained from a Millipore Milli-Q® UF Plus purification system (Millipore, Bedford, MA, USA). Human plasma was kindly provided by King Khaled University Hospital (King Saud University, Riyadh, KSA). After informed consent was obtained, fasting blood samples were taken and plasma, separated and stored at -70 °C.
Preparation of standard solutions
VDB stock solution of 1 mg mL-1 was prepared by dissolving 25 mg of VDB reference standard powder into 25 mL of acetonitrile in a 25 mL measuring flask and completing the volume properly by the same solvent. VDB stock solution was further diluted with acetonitrile to yield a working standard solution of 1 μg mL-1. The standard solutions were stable for at least 14 days when kept refrigerated at -4 oC.
Construction of calibration graph
Different volumes of VDB standard solution were transferred into a series of 5 mL volumetric flasks and diluted with acetonitrile to yield final concentrations of 20 – 600 ng mL-1. The contents of the flasks were well mixed and RFI of VDB was measured at 480 nm after excitation at 330 nm. For generation of calibration curve, RFI at 480 nm (as y axis) was plotted vs the final VDB concentration in ng mL-1 (as x axis) and then the regression equation was calculated.
Assay of VDB tablet samples
Preparation of tablets of VDB produced in-house (equivalent to 100 mg of the drug) took place through weighing precise amount of powder equivalent to 100 mg VDB and transferring it to a 100 mL volumetric flask. Acetonitrile (50 µL) was then added and the contents were shaken and sonicated for 10 and 5 min, respectively. Ultimately the volume was diluted to 100 mL with acetonitrile to get final concentration of 1 mg mL-1. This solution was subsequently diluted by acetonitrile for further analysis.
Assay of VDB in human plasma
Liquid-liquid extraction was used for extraction of VDB from spiked plasma samples. Frozen Plasma samples (-20 oC) were thaw at room temperature before processing. Twenty microliters of standard VDB solutions (at different concentrations of the drug) was spiked into one mL of free drug human plasma and mixed well for one min to yield final spiked plasma concentrations of 200, 300 and 400 ng mL-1, respectively. One mL of 100 mM NaOH / glycine buffer (pH 12) was added and the tube was mixed properly for 10 s using vortex mixer. Five mL of diethyl ether was added and the solution was vortexed for 30 s and ultra-centrifuged for 15 min at 10000 rpm to ensure complete phase separation. Afterwards three mL of the upper organic layer was taken to glass vials and dried under gentle stream of nitrogen. Ultimately, residue reconstitution took place in acetonitrile and the procedures depicted under “Construction of the calibration graph” were then followed. RFI was determined at 480 nm after excitation at 330 nm and the concentration of the drug was calculated by substitution in the corresponding regression equation. A blank plasma sample was treated in a similar way.
Assay of VDB in human urine
Free drug human urine (1 mL) was spiked with twenty µL of standard drug solutions (at different concentrations of VDB) to yield concentrations of 15, 25 and 75 µg mL-1, respectively and mixed for 60 s. Further dilution done by adding thirty µL from the prepared previous solution to a thirty microliters of 100 mM NaOH / glycine buffer (pH 12) then the tube was vortexed for 10 s. 1250 µL of diethyl ether was added and the solution was vortexed for 30 s and ultra-centrifuged for 15 min at 10000 rpm to assure complete phase separation. Then one mL of the upper organic layer was transferred into glass vial and dried under a gentle stream of nitrogen. Finally, reconstitution of the residue occurred in acetonitrile and the procedures depicted under “Construction of the calibration graph” were then followed. A blank urine sample was treated similarly. Fluorescence intensity was determined at 480 nm after excitation at 330 nm and the VDB concentration was calculated by substitution in its corresponding regression equation.
Data analysis
Analysis of data was carried out using Microsoft Excel-2007 software. Differences were considered statistically significant at p < 0.05. The data from fluorescence spectrometer were analyzed using Spectra Manager® software.
Results
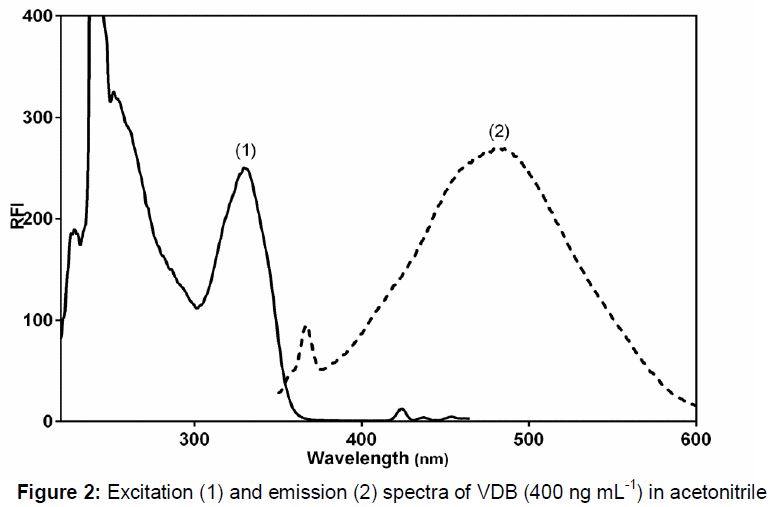
The fluorescence spectra of VDB in acetonitrile is illustrated in . VDB, being a native fluorescent molecule, exhibited excitation and emission wavelengths of 330 and 480 nm, respectively.
Effect of pH
The effect of pH on the fluorescence intensity of VDB was carefully studied using different buffers covering the pH range of 2 - 12. It was observed that fluorescence intensity of VDB is not affected by adding any buffer. Thus, no buffer was added in the current work.
Effect of diluting solvent and time
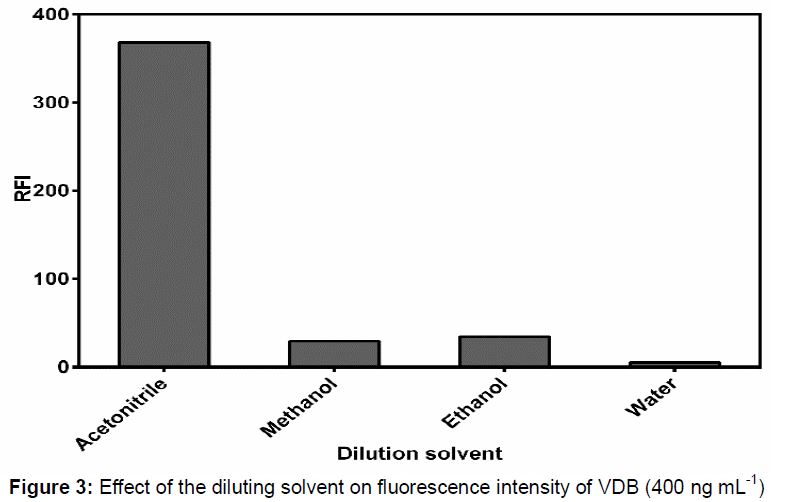
The effect of addition of various diluting solvents for instance water, short chain alcohols (methanol and ethanol) and acetonitrile on the fluorescence intensity of VDB was evaluated (). It was observed that acetonitrile gave the highest response while distinct and sharp decrease in VDB fluorescence intensity was observed on adding other solvents. Accordingly, acetonitrile was utilized for dilution purpose in the current method.
Regarding time effect, it was found that VDB fluorescence intensity developed instantaneously and remained stable for at least 1 h.
Validation results
Validation of the current spectrofluorimetric method was done in accordance with the recommendations of International Conference on Harmonisation (ICH) for validation of the analytical procedures [14].
Linearity and range
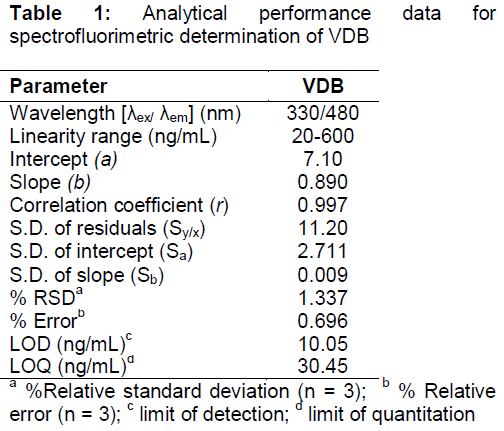
Calibration curve for VDB assay was constructed under the optimum conditions by plotting VDB fluorescence intensity at 480 nm against the corresponding VDB concentration. The linearity range was found to be 20 - 600 ng mL-1 as shown in .
Statistical analysis [15] of the experimental data displayed high correlation coefficients (r) values (approaching to unity) and low values of; intercept (Sa), slope (Sb), standard deviation of residuals (Sy/x), percentage relative error and percentage relative standard deviation (in ). These values established the linearity of VDB calibration curve.
Limit of quantitation (LOQ) and limit of detection (LOD)
Limit of quantitation and detection (LOQ and LOD respectively) were computed by measuring; the minimal concentration below which the calibration curve is nonlinear (for LOQ) and the minimal detectable VDB concentration (for LOD). The values of LOQ and LOD were calculated according to Eqs 1 and 2.
LOD = 3.3ρ ……………………. (1)
LOQ = 10ρ …………………….. (2)
where ρ is the ratio of standard deviation of the intercept and the slope of regression line. The results are displayed in .
Maximum concentration of VDB in plasma (Cmax) reported in the literature [9] is ranged from 117.3 - 131.4 ng mL-1 which is greater than LOQ value (30.45 ng mL-1) and consequently quantitation of VDB can be done easily by the proposed spectrofluorimetric method.
Accuracy and precision
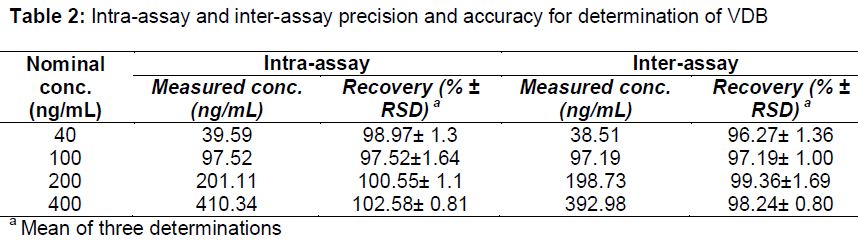
presented results that verify the accuracy and precision of our suggested method. Intra-day and inter-day precision calculation involve the analysis of triplicate sample in one day and three successive days respectively.
Recovery (% ± RSD) was utilized for stating intra-day and inter-day precisions. Low values of RSD and about 100% mean recovery% demonstrated intra and inter-day precisions of the adopted spectrofluorimetric method ().
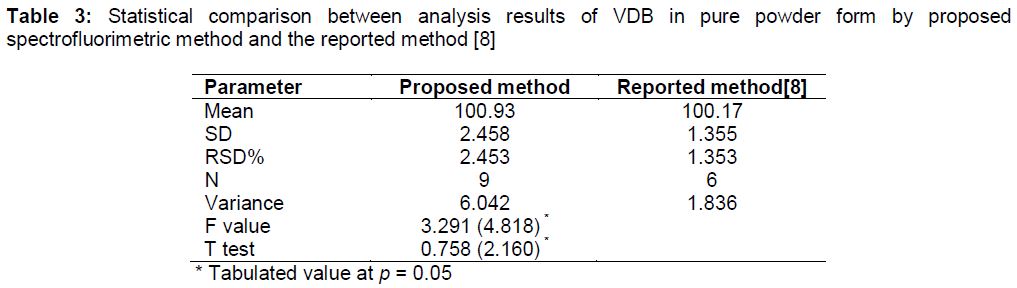
Moreover, the comparison achieved between the results of determination of VDB in pure form with the results of VDB determination by the published LC-MS/MS method [8] showed the accuracy of the current proposed method. Computed F and t- values were smaller than the tabulated values at 95 % confidence level () which in turn confirmed that there is no significant differences between the two methods in terms of accuracy and precision.
Specificity
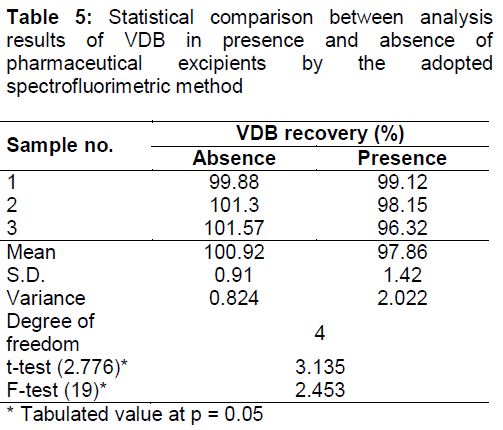
By analyzing laboratory prepared tablets of VDB (CAPRELSA™ tablets), it was clear from the results that the excipients did not interfere with VDB determination which reveal the specificity of the current method ().
Application of proposed method to assay of VDB tablets
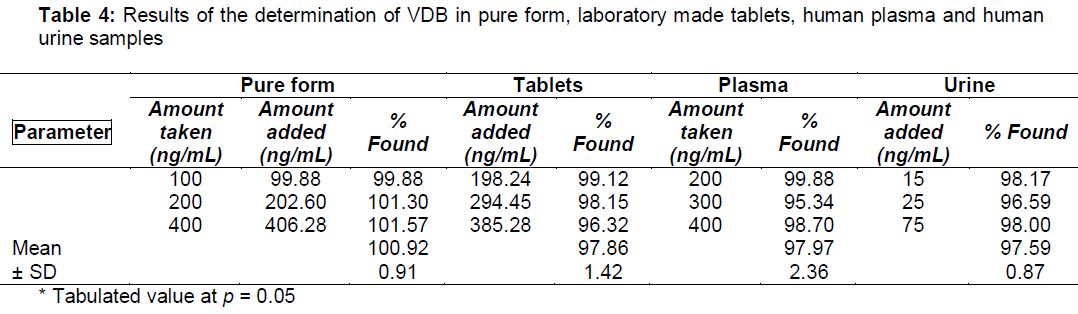
On application of the proposed method to VDB tablets, recovery of VDB in the tablets was 97.86 ± 1.42 % which indicates good accuracy of the proposed procedure (). By comparing the results of bulk powder analysis in absence and presence of excipients found in VDB tablets, it can be seen that there is no significant difference in the two conditions in terms of accuracy and precision (). The excipients added are magnesium stearate, microcrystalline cellulose, crospovidone, povidone and calcium hydrogen phosphate dehydrate.
Application of proposed method to determination of VDB in human plasma
The sensitivity of the adopted spectrofluorimetric method allowed us to quantify VDB in spiked human plasma. Maximum concentration of VDB in plasma attained after 6 h following oral administration [9] where its Cmax value was 131.4 ngmL-1 under fasted circumstances [9]. Hence, level of VDB in plasma is involved in the linear range of the current procedure (). displayed mean recovery % and RSD% of VDB in spiked plasma samples (97.97 %, 2.36 % respectively).
Application of proposed method to assay of VDB in urine
In the first three days, VDB excreted in urine largely unchanged and ranged from 1.9 - 3.4 % of normal adult dose (300 mg daily) [9]. Consequently, the range of VDB concentration in urine (1.9 - 3.4 µg mL-1) is above the linear range of the current procedure. Mean recovery and RSD for VDB in urine samples were 97.59, and 0.87 %, respectively.
Discussion
In this study, a unified procedure was proposed for determination of VDB in different matrices including pharmaceutical preparation, human plasma and urine. Upon examination of literature, it was observed that few analytical methods were reported for VDB determination. Accordingly, a simple and sensitive spectrofluorimetric method was developed in the current work for VDB quantitation in these different matrices. Generally, the fluorescence spectrum of a native fluorescent drug composed of two spectra, the first spectrum associated with the excitation behavior of the drug while the other one associated with its emission of the absorbed electromagnetic radiation (EMR). Excitation spectrum is acquired by scanning excitation monochromator and fixing emission monochromator at a certain wavelength. The emission spectrum is acquired similarly, but scanning the emission monochromator and fixing the excitation monochromator at a particular wavelength. Therefore, for a fluorescent drug, two wavelengths are detected where highest response observed in the excitation and emission spectra (λex and λem, respectively).
The principal demand for a drug to produce a fluorescence spectrum is to absorb EMR. VDB displays an excitation wavelength of 330 nm. This is due to absorption of EMR encouraging electron from its ground state to the excited state. The emission spectrum of VDB was then measured (utilizing concentration of 400 ng mL-1) keeping the excitation monochromator at 330 nm and scanning the emission monochromator in the range of 300 – 600 nm. Highly intense emission peak with maximum at 480 nm was observed, demonstrating the native fluorescence behaviour of VDB. Then the excitation spectrum was recorded, but now keeping the emission monochromator at 480 nm and scanning the excitation monochromator to precisely detect λex which observed at 330 nm.
Various parameters that may influence fluorescence intensity of VDB were adjusted carefully adopting changing one factor at a time strategy. From the previous results it was clear that the most effective parameter was the diluting solvent. Acetonitrile was chosen for conducting this study as it gave the highest fluorescence intensity. This may be due to alteration of the polarity of the medium which could result in physical interaction between the excited singlet state of the analyte molecules and the solvents molecules.
Conclusion
The developed spectrofluorimetric method is simple, sensitive and can be applied successfully to VDB quantitation in quality control and clinical laboratories. The method offers several advantages over published chromatographic methods for VDB determination, including simplicity, rapidity and low cost. Additionally, the method is based on measuring the native fluorescence property of VDB and thus, there is no need to use expensive fluorogenic reagents.
Declarations
Acknowledgement
References
Archives


News Updates